| Trend | |||||||
| USDJPY | USDCHF | USDCAD | EURUSD | GBPUSD | AUDUSD | NZDUSD | |
| 6-month | Flat | Flat | Flat | Down | Flat | Down | Down |
| 3-month | Flat | Up | Up | Down | Down | Down | Down |
| 1-month | Down | Up | Up | Down | Down | Down | Down |
Wednesday, August 6, 2014
7 USD Pairs Trend Table - August 6, 2014 (Wednesday)

Tuesday, July 29, 2014
S&P 500 Index near term could pull back to the 50 day moving average key support zone amid weakening momentum indicators
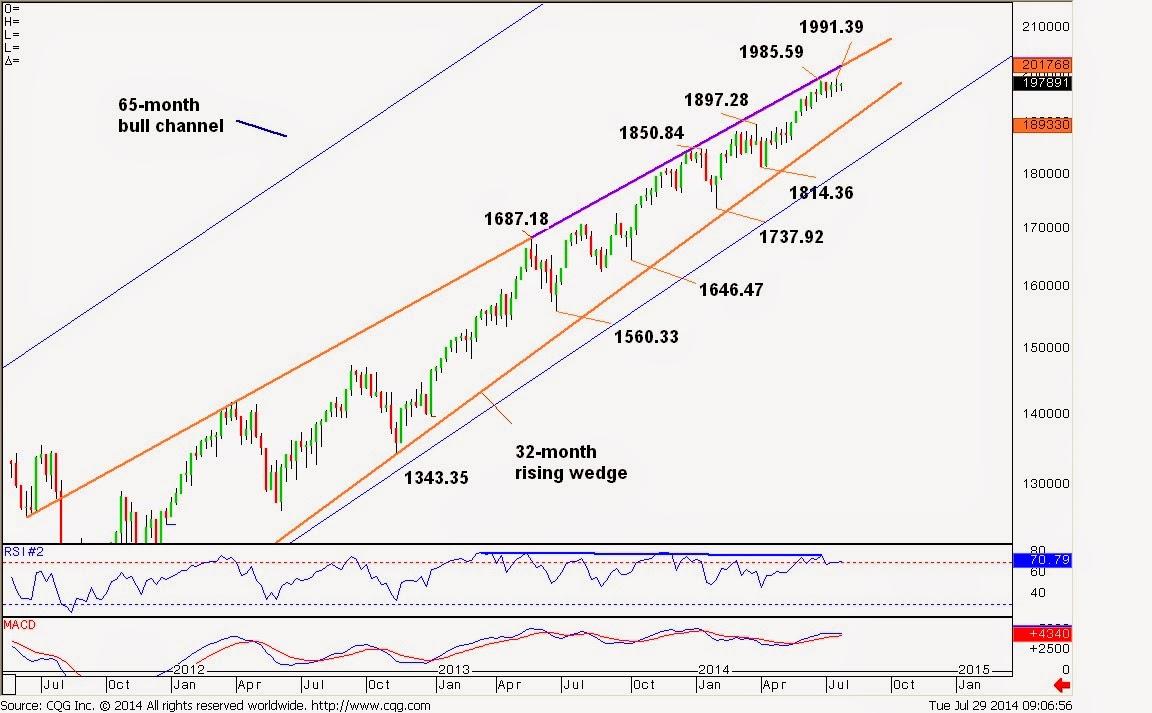
S&P 500 Index advanced to a new record high at 1991.39
(24 July 2014) (near the rising wedge resistance on the monthly chart in log
scale) before consolidating. (please refer to the monthly chart in the prior
post.)
Near term, with potential negative daily RSI divergence from
the price (linking 1985.59/1991.39 highs) and MACD below the signal line, there
is scope for prolonged consolidation within the 4-1/2 week rising wedge
(linking 1985.59/1991.39 highs and 1944.69/1955.59 lows on the daily chart). If
the 1991.39 peak manages to cap near-term, the index would retest the 1952.86 higher
low near the 50 day moving average currently at 1950.24 which may contain
pullbacks.
A move back above 1991.39 is needed to complete a higher
base and signal resumption of broad uptrend towards the 2000.00 psychological
level). Above there would open the next Fibonacci target at 2047.41 (projected 666.79/1364.56
from 1074.77).
On the downside, if the index breaks below the 50 day moving
average, it would suggest near-term topping and trigger further weakness
towards 1944.69. Below lies the 1925.78 and 1902.17 near the bull channel
support (from June 2013 low).
Strategy
Buy on pullbacks to 1950.00 area
Stop below 1950.00
Target 2000.00
Sell on rallies to 1944.00-1950.00 area
Stop above 1950.00
Target 1900.00
S&P 500 Index daily

S&P 500 Index monthly and weekly charts (log scale): long-term uptrend is to approach the rising wedge apex
S&P 500 Index monthly (log scale)

S&P 500 Index weekly (log scale)
US Dollar Index (DXY) posts new 6 month highs towards the 81.482/81.388 range resistance area; strong momentum suggests further upside; Buy on pullbacks
US Dollar Index (DXY) channeled up strongly for the last three
weeks to threaten the 81.482/81.388 8-month resistance zone. With the daily and
weekly indicators still bullish, scope remains for further upside. Reclaiming 81.482
would complete an 11-month flat base over the 78.998/78.906 lows and trigger
further gains towards 82.671 (Sept 5, 2013 lower high) initially. 80.801 near
the 3-week channel support should hold dips. Only below there would dampen the
bullish momentum and expose 80.420 and the 200 day moving average currently at
80.292.
Trading Bias
Near term, buy on pullbacks
Buy zone around 80.700-80.800
Stop below 80.420
Target near 81.480 – 81.600
DXY daily chart

DXY weekly chart

Saturday, July 26, 2014
USDCAD bases above key retracement and 20-month moving average; Buy on dips
USDCAD stabilized at 1.0618 (July 3 low) which is just
above the rising 20 month moving average and near 61.8% of the 1.0182/1.1280
up-move (see monthly/weekly chart), signaling basing.
On the daily chart, the recent rebound off the double bottom
(1.0618/1.0626) breaks above the 4-month falling trendline (red line),
signaling more bullish momentum ahead. The improving indicators confirm the
view.
On the 240minute chart, the pair broke out of a bullish
triangle pattern, looking to test 1.0795 near the 50 day moving average (aqua
line, daily chart). Above there lies resistance cluster including the prior
swing lows at 1.0813/1.0819, 200 day MA at 1.0829 and 61.8% of the 1.0962/1.0618
fall. An extension through there would target 1.0890 near 76.4% retracement.
Trading bias:
Buy zone around 1.0740-1.0750
Stop below 1.0709
Target near 1.0825 - 1.0890
Long-term:
Buy zone around 1.0700
Stop below 1.0618
Target near 1.1054
USDCAD monthly chart


Thursday, July 24, 2014

Major Support and Resistance Levels for 7 USD pairs and ATR (daily)
| Key Levels | |||||||
| USDJPY | USDCHF | USDCAD | EURUSD | GBPUSD | AUDUSD | NZDUSD | |
| Resistance 3 | 102.39 | 0.9158 | 1.0826 | 1.3575 | 1.7119 | 0.9600 | 0.8721 |
| Resistance 2 | 102.28 | 0.9130 | 1.0795 | 1.3550 | 1.7097 | 0.9546 | 0.8697 |
| Resistance 1 | 102.04 | 0.9084 | 1.0768 | 1.3510 | 1.7055 | 0.9506 | 0.8649 |
| Support 1 | 101.41 | 0.8991 | 1.0709 | 1.3399 | 1.6952 | 0.9380 | 0.8556 |
| Support 2 | 101.07 | 0.8967 | 1.0660 | 1.3357 | 1.6883 | 0.9330 | 0.8517 |
| Support 3 | 100.82 | 0.8951 | 1.0618 | 1.3319 | 1.6845 | 0.9278 | 0.8452 |
| Daily ATR (14) | 0.36 | 0.0034 | 0.0049 | 0.0044 | 0.0068 | 0.0054 | 0.0058 |
Subscribe to:
Posts (Atom)