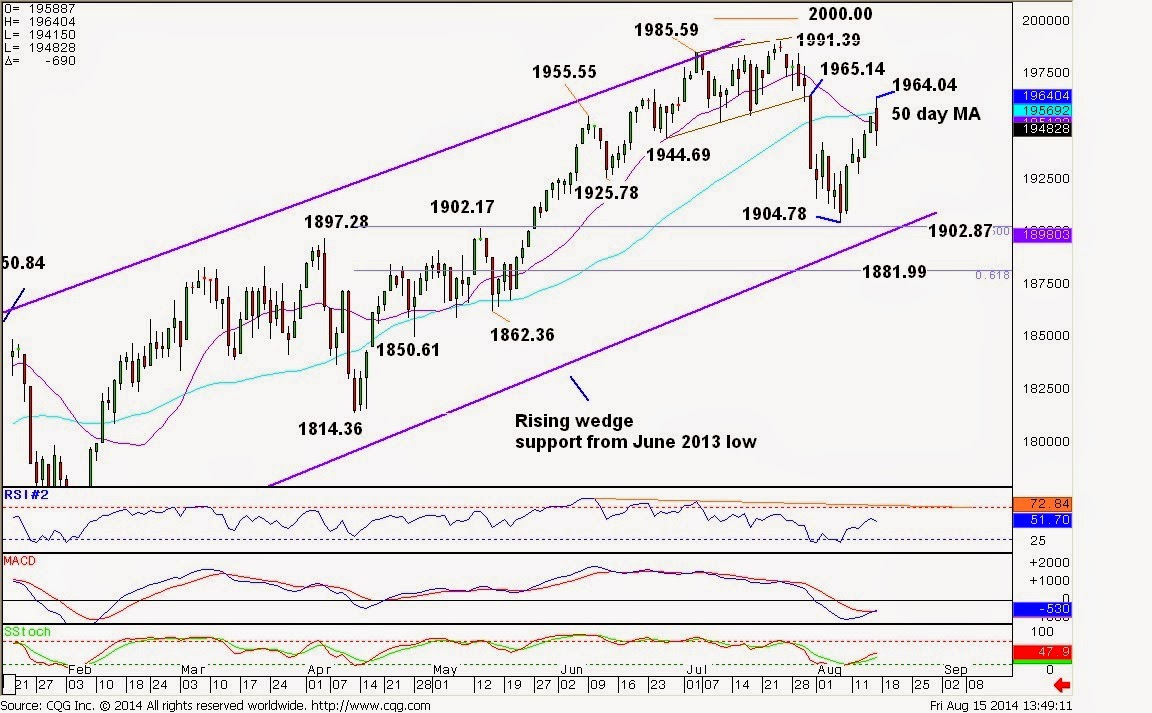
The rebound off last Thursday’s 1904.78 low seems to be corrective. The index reached 1964.04 Friday (Aug 15th) and tested
20 day moving average (purple line) and 50 day moving average (aqua line)
before reversing lower. With the indicator still weak, scope remains for the
index to form a swing high under the 1964.04/1965.14 resistance zone ahead of
extending lower to retest the 1904.78 low and 1902.87/1902.17 support area near
the rising wedge support (thick purple trendline).
On the upside, a decisive break through the 1964.04/1965.14
resistance zone would signal basing and resumption of the broad uptrend towards
the 1991.39 record high for a retest.
Trading bias:
Sell Short under 1964.04 area
Stop above 1980-1992
Target around 1904-1902 then 1881
S&P 500 Index daily chart

No comments:
Post a Comment