Tuesday, July 29, 2014

S&P 500 Index near term could pull back to the 50 day moving average key support zone amid weakening momentum indicators

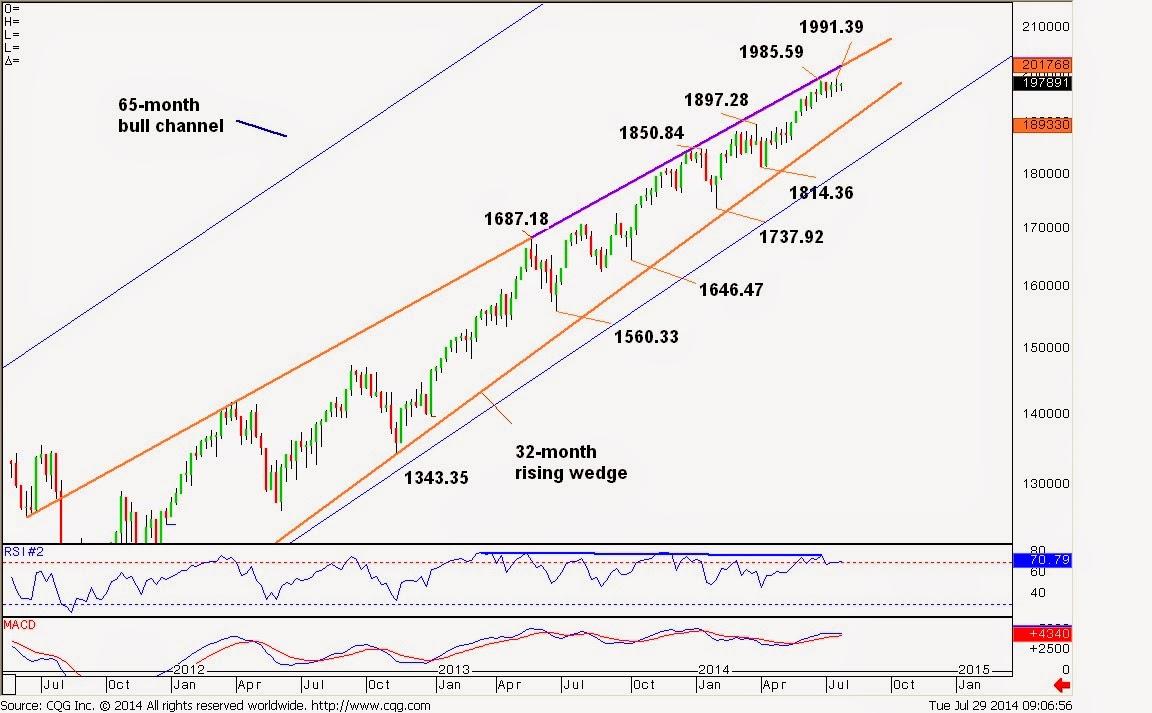
S&P 500 Index advanced to a new record high at 1991.39 (24 July 2014) (near the rising wedge resistance on the monthly chart in log scale) before consolidating. (please refer to the monthly chart in the prior post.)
Near term, with potential negative daily RSI divergence from the price (linking 1985.59/1991.39 highs) and MACD below the signal line, there is scope for prolonged consolidation within the 4-1/2 week rising wedge (linking 1985.59/1991.39 highs and 1944.69/1955.59 lows on the daily chart). If the 1991.39 peak manages to cap near-term, the index would retest the 1952.86 higher low near the 50 day moving average currently at 1950.24 which may contain pullbacks.
A move back above 1991.39 is needed to complete a higher base and signal resumption of broad uptrend towards the 2000.00 psychological level). Above there would open the next Fibonacci target at 2047.41 (projected 666.79/1364.56 from 1074.77).

On the downside, if the index breaks below the 50 day moving average, it would suggest near-term topping and trigger further weakness towards 1944.69. Below lies the 1925.78 and 1902.17 near the bull channel support (from June 2013 low).

Strategy

Buy on pullbacks to 1950.00 area
Stop below 1950.00
Target 2000.00

Sell on rallies to 1944.00-1950.00 area
Stop above 1950.00
Target 1900.00


S&P 500 Index daily

S&P 500 Index monthly and weekly charts (log scale): long-term uptrend is to approach the rising wedge apex

S&P 500 Index monthly (log scale)


 S&P 500 Index weekly (log scale)


US Dollar Index (DXY) posts new 6 month highs towards the 81.482/81.388 range resistance area; strong momentum suggests further upside; Buy on pullbacks


US Dollar Index (DXY) channeled up strongly for the last three weeks to threaten the 81.482/81.388 8-month resistance zone. With the daily and weekly indicators still bullish, scope remains for further upside. Reclaiming 81.482 would complete an 11-month flat base over the 78.998/78.906 lows and trigger further gains towards 82.671 (Sept 5, 2013 lower high) initially. 80.801 near the 3-week channel support should hold dips. Only below there would dampen the bullish momentum and expose 80.420 and the 200 day moving average currently at 80.292.

Trading Bias
Near term, buy on pullbacks
Buy zone around 80.700-80.800
Stop below 80.420
Target near 81.480 – 81.600


DXY daily chart


DXY weekly chart


Saturday, July 26, 2014

USDCAD bases above key retracement and 20-month moving average; Buy on dips

USDCAD stabilized at 1.0618 (July 3 low) which is just above the rising 20 month moving average and near 61.8% of the 1.0182/1.1280 up-move (see monthly/weekly chart), signaling basing. 

On the daily chart, the recent rebound off the double bottom (1.0618/1.0626) breaks above the 4-month falling trendline (red line), signaling more bullish momentum ahead. The improving indicators confirm the view.

On the 240minute chart, the pair broke out of a bullish triangle pattern, looking to test 1.0795 near the 50 day moving average (aqua line, daily chart). Above there lies resistance cluster including the prior swing lows at 1.0813/1.0819, 200 day MA at 1.0829 and 61.8% of the 1.0962/1.0618 fall. An extension through there would target 1.0890 near 76.4% retracement.

On a pullback, the 1.0790 zone should support dips (i.e., where stops for long trade should be). Below there would shift the focus back to the 1.0618/1.0626 basing zone. A clean breakdown there would signal topping under the 200 day MA and resume the downtrend off March 2014 peak towards 1.0182.

Trading bias:
Short term: 
Buy zone around 1.0740-1.0750
Stop below 1.0709
Target near 1.0825 - 1.0890

Long-term:
Buy zone around 1.0700
Stop below 1.0618
Target near 1.1054


USDCAD monthly chart

 USDCAD weekly chart
 USDCAD daily chart
 USDCAD 240min chart

Thursday, July 24, 2014

July 24 (Thursday): Trading Bias for 7 USD pairs

Major Support and Resistance Levels for 7 USD pairs and ATR (daily)

Key Levels
USDJPY USDCHF USDCAD EURUSD GBPUSD AUDUSD NZDUSD
Resistance 3      102.39     0.9158     1.0826     1.3575     1.7119     0.9600     0.8721
Resistance 2      102.28     0.9130     1.0795     1.3550     1.7097     0.9546     0.8697
Resistance 1      102.04     0.9084     1.0768     1.3510     1.7055     0.9506     0.8649
Support 1      101.41     0.8991     1.0709     1.3399     1.6952     0.9380     0.8556
Support 2      101.07     0.8967     1.0660     1.3357     1.6883     0.9330     0.8517
Support 3      100.82     0.8951     1.0618     1.3319     1.6845     0.9278     0.8452
Daily ATR (14)          0.36     0.0034     0.0049     0.0044     0.0068     0.0054     0.0058

Trend direction table for 6 USD pairs

Trend Table
USDJPY USDCHF USDCAD EURUSD GBPUSD AUDUSD NZDUSD
6-month Flat Flat Down Down Up Up Up
3-month Flat Up Down Down Up Up Up
1-month Flat Flat Up Down Down Flat Down

Wednesday, July 23, 2014

AUDUSD rebounded strongly off a 4-month rising trendline and 50 day MA to eye .9506 amid improving indicators

AUDUSD found support at .9330 last week and rebounded strongly after testing a 4-month rising trendline (blue line, daily chart) and the 50 day moving average (aqua line). The daily MACD is about to cross above the signal line, suggesting scope for further upside.
Clearing .9457 would confirm a base over .9322/.9330 zone and trigger further strength towards .9506 peak. Above there would extend the 6-month uptrend towards .9545/.9600.
However, if the pair fails to break through .9506 zone which is near 76.4% of the entire .9758/.8658 fall (as shown on the weekly chart), that would suggest further consolidation. A push below .9380 (Jul 23 low, 240min chart) would signal further ranging and test .9330 area. A clean breakdown there would confirm a multi-week top and accelerate weakness towards .9208/.9202 near the 200 day moving average (black line, daily chart).

Trading bias:

Buy zone around .9410/.9420
Stop below .9380
Target near .9506/.9545

AUDUSD  weekly chart

 AUDUSD  daily chart
 AUDUSD  240min chart

Tuesday, July 22, 2014

S&P 500 Index clears a 4-week triangle resistance to eye early July's 1985.59 record high


S&P 500 Index probed above a 4-week triangle pattern resistance to confirm a higher base over 1952.86, extending the broad uptrend to test the early July’s 1985.59 record high. Above lies the 2000.00 psychological level ahead of the Fibonacci projections at 2004.44 then 2011.33.
However, with the daily MACD below the signal line, it is possible we could see a fake breakout. If the 1985.59 area manages to cap the rebound, the index would remain range bound to retest the 1952.86/1944.69 support zone. 

Trading bias:
Buy zone: 1967.00 area
Stop below 1965.00
Target near 2000.00 possibly 2011.00


S&P 500 Index daily chart

 S&P 500 Index 240min chart
 S&P 500 Index 15min chart

Thursday, July 17, 2014

NZDUSD broke below a 3-week rising trendline amid potential bearish weekly divergence, offering scope for further downside towards key retracements


NZDUSD rallied to .8836 on July 10th, a new 3-year high near August 1 2011 peak at .8843. However, the potential bearish RSI divergence on the weekly chart cautions. 
The retreat of the .8836 peak broke through a 3-week rising trendline from .8662 low, exposing .8662 area near 38.2% of the .8402/.8836 upswing.  Beneath lies the next support at .8642 near the 50 day moving average ahead of .8619, 50% retracement, where buyers may emerge.
On the upside, a reversal back through the .8751/.8771 resistance zone (10/20 day moving averages and the aforementioned trendline support now resistance) is needed to suggest basing and signal a return of strength towards .8836.

Trading bias:

Sell zone around .8720/.8740
Stop above .8771
Target near .8642

NZDUSD weekly chart


 NZDUSD daily chart


 NZDUSD 240min chart


Wednesday, July 16, 2014

EURUSD extends lower towards key support zone as 7-month rising wedge breakdown and 50/200 MAs dead cross weigh on the pair


The 7-month rising wedge breakdown in early May continues to weigh on the pair. EURUSD has been capped under the falling 50 day MA (aqua line) since the dead cross (50 day MA crossed below 200 day MA (black line)). The recent slide off 1.3652 lower high threatens to test 1.3503/1.3512 supports. Bearish daily studies suggest that a breakdown there is possible to extend weakness towards 1.3477 near 76.4% of the 1.3295/1.3993 rise. Below there would expose last November low at 1.3295.
On the upside, reclaiming 1.3652 then 1.3701 would negate the bearish scenario and stabilize for 1.3735.

Trading bias:
Sell zone: 1.3620/1.3650
Stop above 1.3701

Target near 1.3477

EURUSD daily chart


EURUSD weekly chart

USDCHF stages a multi-month falling channel breakout, triggering further bullish momentum for higher


The double bottom (.8699/.8703) reversal remains intact. The current rebound off the .8856 low (near the 20-week weekly MA and 50% of .8703/.9038 rise) probed above the multi-month falling channel resistance (from .9841 on the weekly chart) to trigger further bullish momentum towards .9038. Bullish studies confirm the view. Above .9038 would stage the key resistance at .9158, near the 200 week MA and the former triangle lower bounds (linking .8931/.9021).
On the downside, a break below .8856 would negate the bullish scenario and retest the .8703/.8699 zone.

Trading bias:
Buy zone: .8920-.8950
Stop below .8856
Target near .9158


USDCHF weekly chart


USDCHF daily chart


USDCHF 240 minute chart

Monday, July 14, 2014

S&P 500 Index (SP) resumes rally towards the 1985.59 YTD high for a retest


Risk is back on Monday.
S&P rebounded off last Thursday’s 1952.86 low (near the 20 day MA) to rise above last Tuesday’s 1976.39 high, forming a 4-day base and opening the 1985.59 YTD high (3 Jul). Clearing the latter would confirm a higher low at 1952.86 and extend the broad uptrend towards the 1994.07 Fibonacci target ahead of the 2000.00 psychological level.  The first support lies at 1969.86 near the 10 day MA. Only a break below there would expose the 1952.86 for a retest.
Levels

Current price from levels
Comments
Resistances


             2,004.44

           27.34
1.618x 1814.36/1902.17 from 1862.36
             2,000.00
 *
           22.90
Psychological level
             1,994.07

           16.97
1.5x 1814.36/1902.17 from 1862.36
             1,985.59
 *
             8.49
Jul 3 2014 YTD high
1977.1


Monday close
Supports


             1,969.86

             7.24
Mon's low near Jul 10 high & 10 day MA at 1971.82
             1,959.63

           17.47
Jul 11 low near 20 day MA at 1963.38
             1,952.86
 *
           24.24
Jul 10 low near Jun 27 low at 1952.18
             1,944.69


Jun 26 higher low near 23.6% of the 1814.36/1985.59 rise
             1,925.78


Jun 12 higher low near 50% of 1962.36/1985.59 rise & 50 day MA at 1928.95
             1,918.60


Jun 4 low near 38.2% of the 1814.36/1985.59 rise
*indicates a strong level

Trade idea:

Buy on dips to 1959.63 area
Place stops below 1952.86

Target 1985.59

S&P 500 Index 240minute chart

S&P 500 Index daily chart

Wednesday, July 9, 2014

US 10-year Treasury yield extends declines within a 4-month falling channel, targeting 2.400 again


10-year treasury yields have been on the decline from the 3.040 high (Jan 2), tracing out a falling 4-month channel (as shown on the daily and weekly charts). Near term, the intraday indicators (as shown on the 240minute chart) are bearish, suggesting scope for further downside, extending the latest easing off the 2.690 high towards 2.506 then 2.400, near the channel lower bounds.

On the upside, a quick upside reversal through 2.690 is needed to negate the weakness and signal channel breakout for 2.818 next.

US 10-year Treasury yield weekly chart

US 10-year Treasury yield daily chart


US 10-year Treasury yield 240min chart

Tuesday, July 8, 2014

S&P 500 Index posted new record level near 14-month rising wedge resistance; extends pullback to relieve overbought condition, targets 50 day MA


S&P 500 Index (SP) posted a new record/YTD high near the 14-month rising channel resistance (from May 2013 high) at 1985.59 before consolidating. Overbought RSI could form potential negative divergence which cautions bulls. Supports rest at 1925.78 near the 50 day moving average (aqua line) which may hold dips. On the upside, over 1985.59 would extend the uptrend towards 2209.2 (equality target of 666.8/1370.6 projected from 1074.8)


SPX daily chart

SPX weekly chart


Thursday, July 3, 2014

US Dollar Index stages a 4-week falling channel breakout to signal basing

US Dollar Index (DXY) rebounded sharply higher off Tuesday’s 79.740 low (near 61.8% of the 78.906/81.020 rise) through a series of daily lower highs to signal basing and test the 80.261 (200 day MA), 80.335 (20 day MA) and 80.379 (26 Jun lower high) resistance area. Improving indicators suggest there is scope for further strength through the resistance zone towards 80.494.
On the downside, below 79.952/79.937 would prolong consolidation and reopen 79.740. A push below the latter would extend the slide off 81.020 towards 79.421.

 DXY 240minute chart


 DXY daily chart


Wednesday, July 2, 2014

USDCAD started oversold bounce after posting new 6-month lows in the vicinity of key support cluster

Usdcad declined off the 1.0962 lower high (5 Jun) for 20 days to reach a new 6-month low at 1.0622 Wednesday. The daily RSI was 15 at Tue’s low, very oversold. As the pair approaches key support cluster including 61.8% of the 1.0182/1.1280 rise at 1.0601, and 1.0616 (Jul 2013 range high) (as shown on the monthly chart), an oversold bounce is warranted.
On the 240min chart, the pair bounced off the 1.0622 Wednesday low to break through the falling wedge upper bounds and the falling 20-period moving average and signal further momentum towards 1.0698, near 23.6% of the 1.0962/1.0622 fall and then 1.0752 (38.2% retracement).
However, a decisive push below the aforementioned 1.0622/1.0616/1.0601 support zone would negate the upside and accelerate lower towards 1.0557 higher low (Dec 2013).   


Usdcad 240minute chart


Usdcad daily chart

Usdcad monthly chart


Tuesday, July 1, 2014

EURGBP continues to descend within 12-month bear channel; could potentially test 6-year support zone

Eurgbp declined off the .8772 peak within a falling channel (as shown on the weekly chart) to post a new YTD low at .7959 before correcting. The pair is probing below the 12-day rising consolidation channel support to expose .7959 (please refer to the 240min chart). Below there would confirm bearish continuation towards .7886/.7810. Eventually the pair could retest the .7694/.7755 6-year support zone (as shown on the monthly chart)
On the upside, back above the .8036 area and then the 4-month falling trendline (orange) would stabilize.


EURGBP 240 minute chart
 EURGBP daily chart
 EURGBP weekly chart
 EURGBP monthly chart