Friday, August 22, 2014

Shanghai Stock Exchange Composite Index (SHCOMP) outperforms S&P and Hang Seng Indexes to test the key resistance


The top panel is the relative strength chart of SHCOMP index v.s. SPX index (green line) and SHCOMP index v.s. HSI (Hang Seng index) (white line). The 50 week moving average of SHCOMP/SPX (pink line) has been capping the decline since the beginning of 2010. The latest push from SHCOMP is probing the pink line again. It needs to decisively break above the key moving average ceiling to suggest basing and offer scope for long-term trend change and further outperformance of SHCOMP index relative to SPX.

The lower panel is the SHCOMP index price chart. The 200 week moving average (blue line) has been capping the decline since April 2010. If the index continues this year’s rally to break above the 2350 area (where 200 week MA is), that would confirm an 18-month base and suggest sustained strength ahead towards the triangle breakout target at 2620.

Trading bias:
Buy on dips

Shanghai Stock Exchange Composite Index (SHCOMP) Relative Strength and Price Weekly Chart


SHCOMP Index Weekly Chart for Triangle Breakout Target


Sunday, August 17, 2014

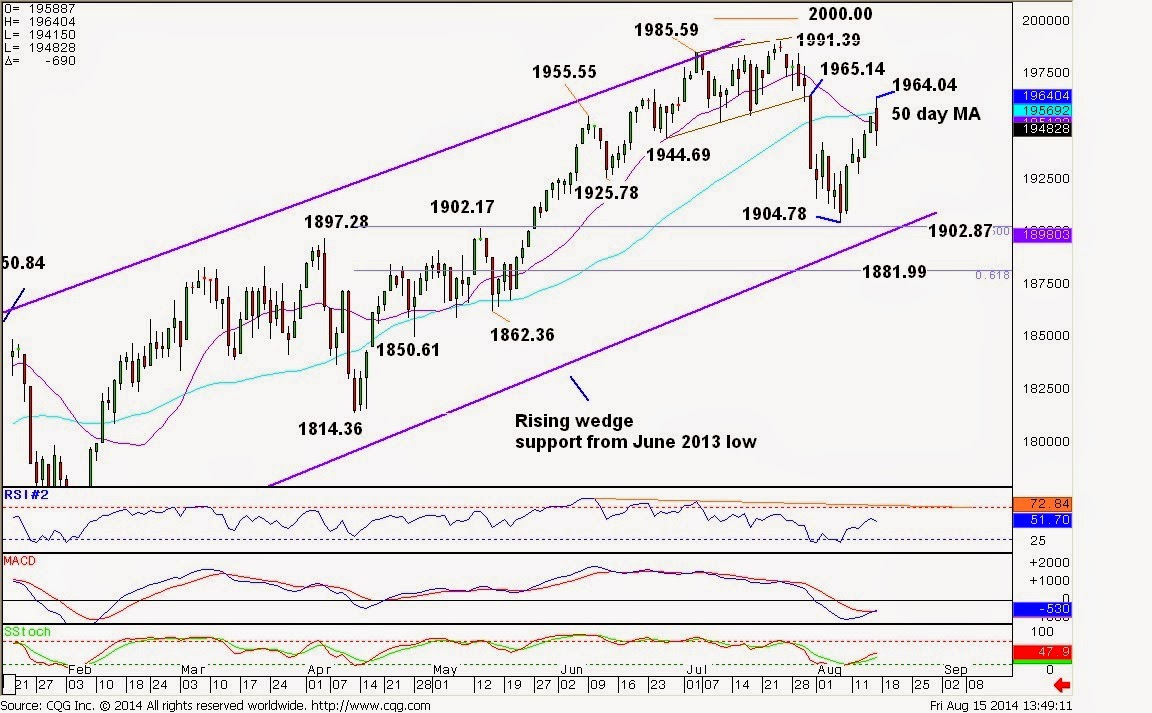
S&P 500 Index may be forming a swing high near the 50 day moving average area ahead of renewed weakness towards 1904.78

The rebound off last Thursday’s 1904.78 low seems to be corrective. The index reached 1964.04 Friday (Aug 15th) and tested 20 day moving average (purple line) and 50 day moving average (aqua line) before reversing lower. With the indicator still weak, scope remains for the index to form a swing high under the 1964.04/1965.14 resistance zone ahead of extending lower to retest the 1904.78 low and 1902.87/1902.17 support area near the rising wedge support (thick purple trendline).
On the upside, a decisive break through the 1964.04/1965.14 resistance zone would signal basing and resumption of the broad uptrend towards the 1991.39 record high for a retest.

Trading bias:
Sell Short under 1964.04 area
Stop above 1980-1992
Target around 1904-1902 then 1881


S&P 500 Index daily chart


Sunday, August 10, 2014

S&P 500 Index Trading Outlook for Next Week

In summary:
·       Last Friday’s strong reversal formed a bullish reversal day, signaling potential for further ranging action next week;
·       Our bias remains bearish as far as the moving averages caps the bounce; as detailed above, 200 day moving average would be the next target.
·       Bulls need to close back above the 3 moving averages to show the correction is over.


Detailed analysis is as follows:

S&P corrected lower from the 1991.39 record peak for 11 days to last Thursday’s 1904.78 low (Aug 11), right into the initial support cluster including the 1902.17 prior high and 50% retracement of the 1814.36/1991.39 rise, before consolidating.

The short-term 10 day moving average (pink) has crossed below the 20 and 50 day moving averages, turning the chart view negative. The MACD and RSI are both in the negative territory, pointing lower.


Chart 1
S&P daily chart as of August 8, 2014


Whether last Thursday’s 1904.78 low is the corrective low, and where the market could trade next week, let’s take a look at how the past corrections ended. 


Comparison of Past Corrections


Time span
# of trading days
Total points from high to low
% change
2010


Jan 15 to Feb 5
14
              105
-9.12%

Apr 26 to May 25
22
              178
-14.61%
2011


Feb 18 to Mar 16
18
                92
-6.85%

May 2 to Jun 16
33
              112
-8.17%

Jul 7 to Aug 9
24
              254
-18.68%

Aug 31 to Oct 4
24
              155
-12.62%

Oct 27 to Nov 25
21
              134
-10.38%
2012


Apr 2 to Jun 4
44
              153
-10.75%

Sep 14 Nov 16
44
              132
-8.95%
2013


May 22 to Jun 24
23
              127
-7.53%

Aug 2 to Aug 28
19
                83
-4.86%

Sept 19 to Oct 9
15
                82
-4.74%
2014


Jan 15 to Feb 5
15
              114
-6.15%

Jul 24 to Aug 7
11
                88
-4.43%


Average
            23
              129
-9.13%

Chart 2
S&P daily chart to show the three corrections in 2013


As shown in the Comparison table above, the average correction drop was 129 points since 2010, lasted 23 trading days on average and ended below the 50 day moving average. If S&P were to drop 129 points, that would take the market down to 1862, where the 200 day moving average (blue line), the 50% retracement of 1731.92/1991.39 rise and 76.4% of the 1814.36/1991.39 rise (as marked on the chart) are located.


Thursday, August 7, 2014

S&P 500 Index weakens further to approach 50% retracement and rising wedge support area


S&P 500 Index

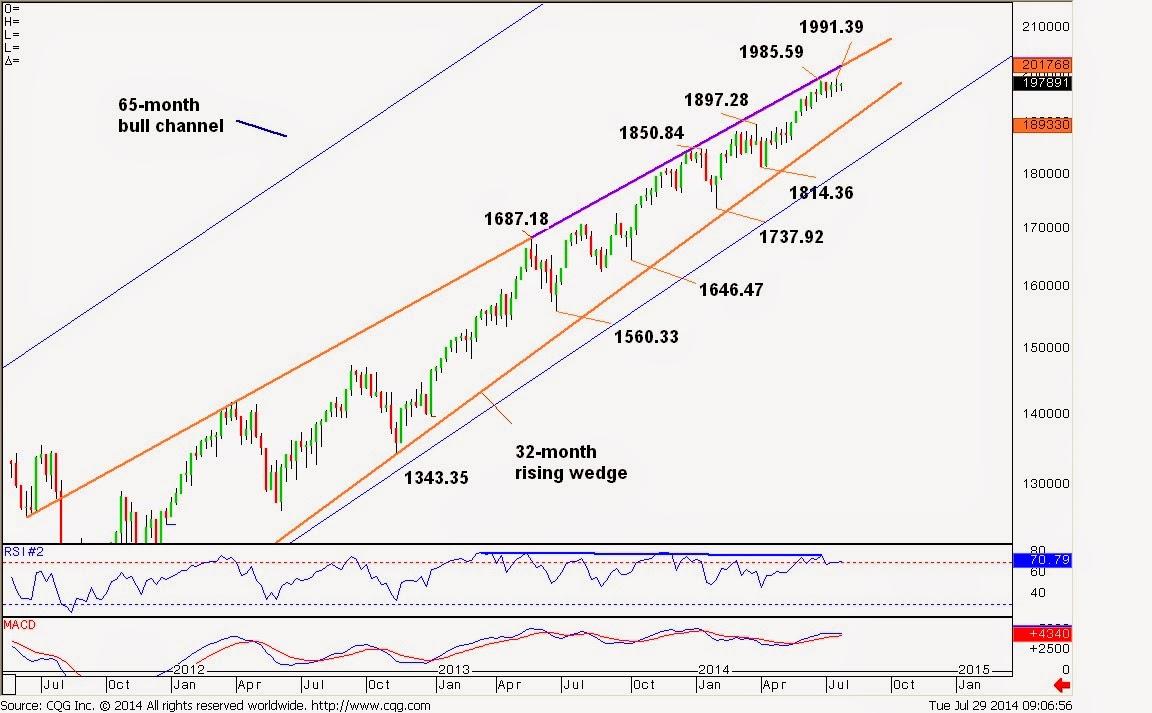
  • The Index tested the long-term bull channel (from March 2009 low)  resistance before consolidating (monthly chart) while the monthly indicators remain in the overbought territory;
  • The current pullback threatens the rising wedge support (from June 2013 low) near the 1900 area (weekly chart); Weekly bearish MACD cross points lower;
  • The daily chart shows that the rising wedge breakdown in July and the break below the 50 day moving average have accelerated the correction towards the 1902.17/1902.87 (50% retracement of 1814.36/1991.39 rise) support zone. Below lies the rising wedge support (purple line on the daily chart) and the 61.8% retracement at 1881.99.
  • On the upside, reclaiming 1942.92 is needed to stabilize. 

Daily chart

Weekly chart

Monthly chart

Dow Jones Industrial Average (DJIA) tests the 200 day moving average

Dow Jones Industrial Average

  • The Index reached the 17152 peak in July, shy of the long-term rising wedge (from October 2011 low) resistance before correcting lower (monthly chart) while the monthly MACD crossed below the signal line and the monthly RSI showed lower highs, suggesting slowing momentum;
  • The current pullback threatens the rising 50 week MA on the weekly chart while both the weekly MACD and RSI have turned bearish, pointing lower;
  • The daily chart shows that the correction has accelerated to test the 200 day moving average. With the daily RSI oversold, there is scope for the Index to consolidate.
  • While the 16596 lower high caps, the Index may have room to go lower towards supports including 16015, then 15935 (50% retracement of 14719/17152 rise). Below lies 15648 (61.8% retracement).
  • On the upside, reclaiming 16596 is needed to stabilize.
 -----------------------------------------------------------------------------------------------------
 Daily chart


Weekly chart

Monthly chart

Wednesday, August 6, 2014

7 USD Pairs Trading Bias Table -- August 6, 2014 (Wednesday)

Trading Bias:


  USDCHF USDCAD
Short term Buy on dips Buy on dips
Buy zone  .9050-.9040   1.0880-1.0890 
Stops below              0.9015                      1.0850
Target near  .9130-.9150   1.0990-1.1100 
========================================

 
  USDJPY EURUSD GBPUSD
Short term Sell on bounces Sell on bounces Sell on bounces
Sell zone  102.30-102.40   1.3410-1.3420   1.6860-1.6870 
Stops above  102.55-102.65                   1.3445                     1.6900
Target near  101.60-101.50   1.3330-1.3310   1.6820-1.6810 

===========================================
 
  AUDUSD NZDUSD
Short term Sell on bounces Sell on bounces
Sell zone  0.9385-0.9395   .8495-.8505 
Stops above  0.9425   0.8532 
Target near  .9310-.9300   .8420-.8410 


7 USD Pairs Support and Resistance Table and ATR -- August 6. 2014 (Wednesday)

Key levels
USDJPY USDCHF USDCAD EURUSD GBPUSD AUDUSD NZDUSD
Resistance 3      102.65     0.9116     1.0987     1.3445     1.6928     0.9418     0.8537
Resistance 2      102.44     0.9105     1.0960     1.3435     1.6900     0.9390     0.8510
Resistance 1      102.31     0.9093     1.0949     1.3426     1.6887     0.9375     0.8487
Support 1      101.78     0.9063     1.0903     1.3360     1.6821     0.9333     0.8454
Support 2      101.70     0.9041     1.0884     1.3354     1.6813     0.9291     0.8422
Support 3      101.60     0.9017     1.0877     1.3333     1.6800     0.9275     0.8400
Daily ATR (14)          0.44     0.0036     0.0053     0.0045     0.0061     0.0057     0.0060

7 USD Pairs Trend Table - August 6, 2014 (Wednesday)

Trend
USDJPY USDCHF USDCAD EURUSD GBPUSD AUDUSD NZDUSD
6-month Flat Flat Flat Down Flat Down Down
3-month Flat Up Up Down Down Down Down
1-month Down Up Up Down Down Down Down


Tuesday, July 29, 2014

S&P 500 Index near term could pull back to the 50 day moving average key support zone amid weakening momentum indicators

S&P 500 Index advanced to a new record high at 1991.39 (24 July 2014) (near the rising wedge resistance on the monthly chart in log scale) before consolidating. (please refer to the monthly chart in the prior post.)
Near term, with potential negative daily RSI divergence from the price (linking 1985.59/1991.39 highs) and MACD below the signal line, there is scope for prolonged consolidation within the 4-1/2 week rising wedge (linking 1985.59/1991.39 highs and 1944.69/1955.59 lows on the daily chart). If the 1991.39 peak manages to cap near-term, the index would retest the 1952.86 higher low near the 50 day moving average currently at 1950.24 which may contain pullbacks.
A move back above 1991.39 is needed to complete a higher base and signal resumption of broad uptrend towards the 2000.00 psychological level). Above there would open the next Fibonacci target at 2047.41 (projected 666.79/1364.56 from 1074.77).

On the downside, if the index breaks below the 50 day moving average, it would suggest near-term topping and trigger further weakness towards 1944.69. Below lies the 1925.78 and 1902.17 near the bull channel support (from June 2013 low).

Strategy

Buy on pullbacks to 1950.00 area
Stop below 1950.00
Target 2000.00

Sell on rallies to 1944.00-1950.00 area
Stop above 1950.00
Target 1900.00


S&P 500 Index daily

S&P 500 Index monthly and weekly charts (log scale): long-term uptrend is to approach the rising wedge apex

S&P 500 Index monthly (log scale)


 S&P 500 Index weekly (log scale)


US Dollar Index (DXY) posts new 6 month highs towards the 81.482/81.388 range resistance area; strong momentum suggests further upside; Buy on pullbacks


US Dollar Index (DXY) channeled up strongly for the last three weeks to threaten the 81.482/81.388 8-month resistance zone. With the daily and weekly indicators still bullish, scope remains for further upside. Reclaiming 81.482 would complete an 11-month flat base over the 78.998/78.906 lows and trigger further gains towards 82.671 (Sept 5, 2013 lower high) initially. 80.801 near the 3-week channel support should hold dips. Only below there would dampen the bullish momentum and expose 80.420 and the 200 day moving average currently at 80.292.

Trading Bias
Near term, buy on pullbacks
Buy zone around 80.700-80.800
Stop below 80.420
Target near 81.480 – 81.600


DXY daily chart


DXY weekly chart