USDCAD was capped by a 17-month falling trendline (25 Nov 2011/4 Jun 2012/1 Mar highs). The subsequent descent has been following a 5-week bear channel (6/19 Mar highs and 15 Mar/2 Apr lows) to reach 1.0105 (4 Apr low) before consolidating. While the 1.0237 (5 Apr high) ceiling limits the bounce, scope remains for further weakness. A break below 1.0105 would signal bear continuation and open .9996 (14 Feb low) near the 200 day moving average currently at .9986. However, recycled strength above 1.0237 would delay and trigger further gains towards 1.0343 (1 Mar high) for a retest.
Tecniview is a blog about quantifying market moves using technical analysis, focusing each day on a single financial instrument.
Wednesday, April 10, 2013
S&P Index – 3-week Range Breakout Posts New All-time Highs
S&P Index broke out of a 3-week consolidation range to confirm a double bottom (at 1538.57/1539.50), extending the broad uptrend to post new all-time highs. Further strength opens the equality target at 1628.15 (1.000x 1573.66 from 1539.50), then Fibonacci projections at 1662.01 (1.382x) ahead of 1682.94 (1.618x). The 1573.66 (2 Apr range high)/1568.61 (10 Apr low) support zone should limit dips. Only sustained weakness below 1538.57/1539.50 would delay bulls and suggest topping for a move towards 1485.01 (26 Feb low).
Monday, April 8, 2013
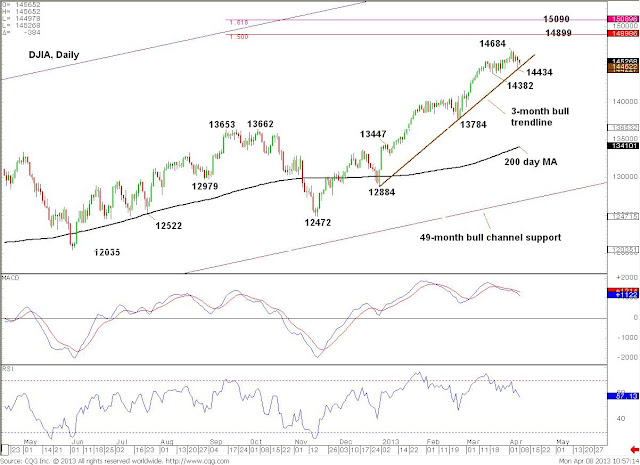
DJIA (Dow Jones Industrial Average) – 3-month Bull Trendline Continues to Support
DJIA posted a new all-time high at 14684 (2 April) before consolidating. While the 3-month bull trendline (off 31 December 2012/25/26 February/5 April lows) support holds, scope remains for further strength targeting the Fibonacci projections at 14899 (1.500x 12035/13653 from 12472) ahead of 15090 (1.618x). A move below 14434 (5 April low) near the bull trendline would open the key 14382 support (19 March low). Only sustained weakness below the latter would delay bulls and expose 13784 (25/26 February low) where bull may reassert.
DJIA (Dow Jones Industrial Average) – 3-month Bull Trendline Continues to support
DJIA posted a new all-time high at 14684 (2 April) before consolidating. While the 3-month bull trendline (off 31 December 2012/25/26 February/5 April lows) support holds, scope remains for further strength targeting the Fibonacci projections at 14899 (1.500x 12035/13653 from 12472) ahead of 15090 (1.618x). A move below 14434 (5 April low) near the bull trendline would open the key 14382 support (19 March low). Only sustained weakness below the latter would delay bulls and expose 13784 (25/26 February low) where bull may reassert.
US 10-year Treasury Note Yields Broke Down from a 3-month Top, Pointing Lower
US 10-year T-note yields formed a 3-month top on breaking below bull trendline support (17/24 Jan/4 Mar lows). Deteriorating daily studies suggest more downside. The break below the 200 day MA support signals a deeper setback towards the key 1.564% (6 Dec 2012 low)/1.541% (4 Sep 2012 low) support zone. Further weakness below would there would expose the record low at 1.378% (25 Jul 2012) for a retest. It would take recycled strength back above the 200 day MA then 1.889% (1 Apr high) to stabilize for a move towards 1.976% (25 Mar high).
U.S. 30-year Treasury Bond Futures Staged 11-week Base Breakout
 T-bond futures rallied through an 11-week base (24 Jan high/8 Mar low) to post new year-to-date highs. While the daily studies continue to strengthen, scope remains for further upside towards 148-25 (28 Dec 2012 high). A break above there would fuel further gains towards 149-29 (14 Dec 2012 high) ahead of the 152-21 key (16 Nov 2012 lower high). 146-01 (4 Apr low) should limit dips. Only sustained weakness below 144-00 (1 Apr low) would delay bulls and expose 142-00 (8 Mar low).
Subscribe to:
Comments (Atom)


